User Profile Machine Learning
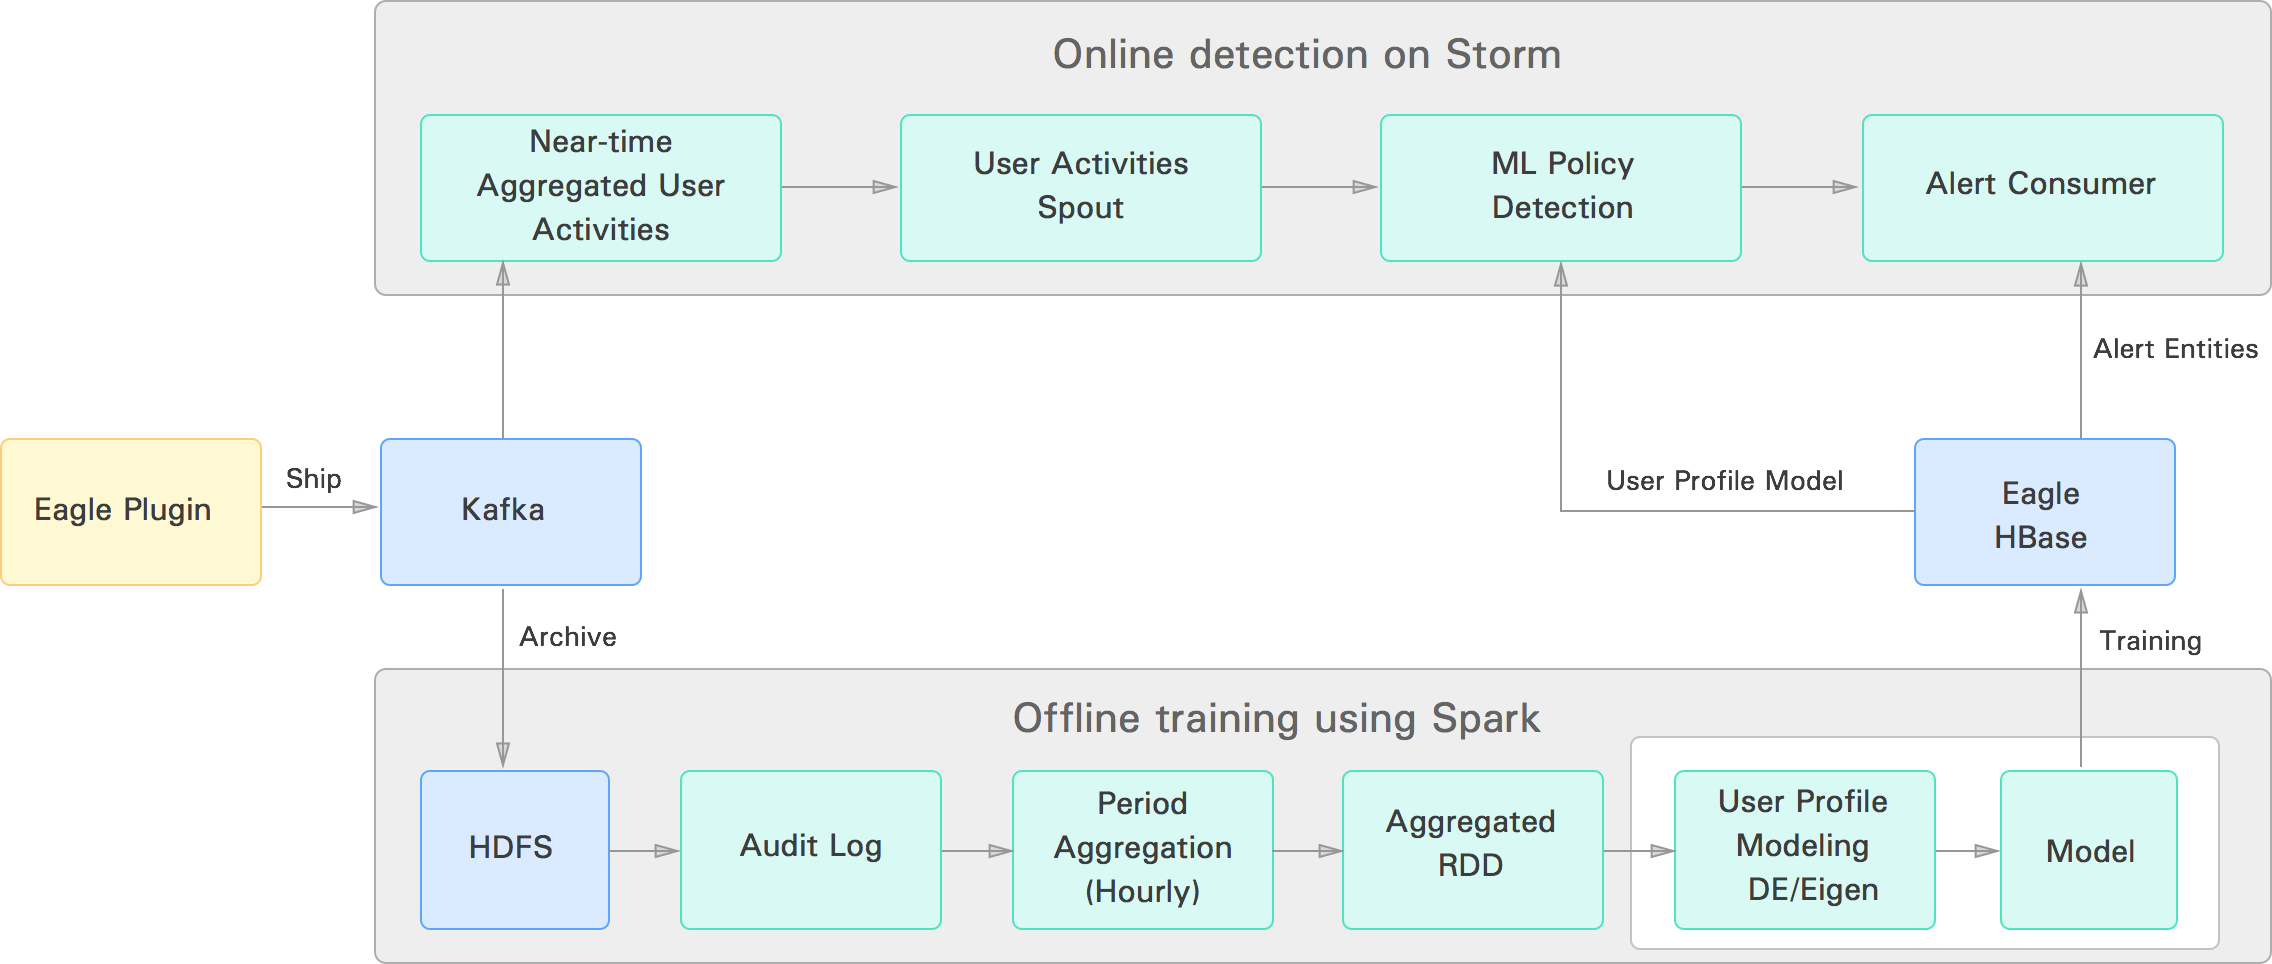
Apache Eagle (called Eagle in the following) provides capabilities to define user activity patterns or user profiles for Apache Hadoop users based on the user behavior in the platform. The idea is to provide anomaly detection capability without setting hard thresholds in the system. The user profiles generated by our system are modeled using machine-learning algorithms and used for detection of anomalous user activities, where users’ activity pattern differs from their pattern history. Currently Eagle uses two algorithms for anomaly detection: Eigen-Value Decomposition and Density Estimation. The algorithms read data from HDFS audit logs, slice and dice data, and generate models for each user in the system. Once models are generated, Eagle uses the Apache Storm framework for near-real-time anomaly detection to determine if current user activities are suspicious or not with respect to their model. The block diagram below shows the current pipeline for user profile training and online detection.

Eagle online anomaly detection uses the Eagle policy framework, and the user profile is defined as one of the policies in the system. The user profile policy is evaluated by a machine-learning evaluator extended from the Eagle policy evaluator. Policy definition includes the features that are needed for anomaly detection (same as the ones used for training purposes).
A scheduler runs a Apache Spark based offline training program (to generate user profiles or models) at a configurable time interval; currently, the training program generates new models once every month.
The following are some details on the algorithms.
- Density Estimation: In this algorithm, the idea is to evaluate, for each user, a probability density function from the observed training data sample. We mean-normalize a training dataset for each feature. Normalization allows datasets to be on the same scale. In our probability density estimation, we use a Gaussian distribution function as the method for computing probability density. Features are conditionally independent of one another; therefore, the final Gaussian probability density can be computed by factorizing each feature’s probability density. During the online detection phase, we compute the probability of a user’s activity. If the probability of the user performing the activity is below threshold (determined from the training program, using a method called Mathews Correlation Coefficient), we signal anomaly alerts.
- Eigen-Value Decomposition: Our goal in user profile generation is to find interesting behavioral patterns for users. One way to achieve that goal is to consider a combination of features and see how each one influences the others. When the data volume is large, which is generally the case for us, abnormal patterns among features may go unnoticed due to the huge number of normal patterns. As normal behavioral patterns can lie within very low-dimensional subspace, we can potentially reduce the dimension of the dataset to better understand the user behavior pattern. This method also reduces noise, if any, in the training dataset. Based on the amount of variance of the data we maintain for a user, which is usually 95% for our case, we seek to find the number of principal components k that represents 95% variance. We consider first k principal components as normal subspace for the user. The remaining (n-k) principal components are considered as abnormal subspace.
During online anomaly detection, if the user behavior lies near normal subspace, we consider the behavior to be normal. On the other hand, if the user behavior lies near the abnormal subspace, we raise an alarm as we believe usual user behavior should generally fall within normal subspace. We use the Euclidian distance method to compute whether a user’s current activity is near normal or abnormal subspace.


